Hello World, This is Saumya, and I am here to help you understand and
implement K-Means Clustering Algorithm from scratch without using any Machine
Learning libraries. We will further use this algorithm to compress an
image. Here, I will implement this code in Python, but you can implement the
algorithm in any other programming language of your choice just by basically
developing 4-5 simple functions.
So now, first of all, what exactly is Clustering and in particular
K-Means?
As discussed in my blog on Machine
Learning, Clustering is a type of unsupervised machine learning problem in
which, we find clusters of similar data. K-means is the most widely used
clustering algorithm. So basically, our task is to find those centers for the
clusters around which our data points are associated.
These centres of the Clusters are called centroids(K).

Note that, these cluster centroids, may or may not belong to our dataset
itself. Since our problem is to choose these points, let's first of all define
the K-Means algorithm.
1. Randomly initialize K cluster centroids.
2. Repeat {
Closest Assignment
Step.
Update Cluster Centroids.
}
So what does it actually mean?
First of all, we'll randomly choose K number of points from our dataset {x(1),x(2),x(3)…,x(m)},
and initialize them as our cluster centroids {µ1, µ2, µ3…µk}.
def ClusterInit(arr,K):
    print("Generating ",K," Clusters from Arr")
    s="Generating "+str(K)+" Clusters from Arr\n"
    a=random.sample(arr,K)
    return a
Then, the next main step is the Closest Assignment Step.
Here,
For each point in
dataset x(1),x(2),x(3)…,x(m),
1. Calculate it's distance from each centroid {µ1,
µ2, µ3…µk}.
2. Select the index of the centroid
closest to x(i), and assign it to c(i).
def Closest(arr,Clusteroids):
    print("Computing Closest Clusteroids")
    indexes=[]
    count=1
    for i in tqdm(arr):
        a="for "+str(count)+" element\n"
        temp =[]
        for j in Clusteroids:
            temp.append(norm(i,j))
        indexes.append(temp.index(min(temp)))
        count+=1
    print(indexes)
    return indexes
Where, the distance between the centroids and a data point is calculated
as a norm of the distance between two vectors. But for the simplicity sake, as
distance is rather a relative feature, we'll simple calculate as a sum of the
absolute values of the difference between the coordinates of them both.
def norm(P1,P2):
    sum=0
    for (i,j) in zip(P1,P2):
        sum+=(abs(i-j))
    return sum
Now moving ahead, next is the update centroid step. In this step, we
select every data point associated with a particular cluster centroid and
replace that particular centroid with the mean of all those associated data
points. For this purpose, we'll refer to the C array which contains the index
of the centroids associated with the particular data point.
i.e. for k=1 to K,
µk=mean
of points assigned to cluster k.
i.e. mean(x(i)) where i is such that c(i)=k.
def ComputeMeans(arr,indexes,Clusteroids):
    newClus=[]
    print(len(arr))
    print(len(indexes))
    print(len(Clusteroids))
    for i in range(len(Clusteroids)):
        z=[]
        for j in indexes:
            if i == j:
                z.append(arr[indexes.index(j)])
        print(z)
        if len(z)==0:
            continue
        else:
            newClus.append(getmean(z))
    for a in newClus:
        if str(newClus)==str(Clusteroids):
            return ("end K Means",newClus)
    return (None,newClus)
Here, we can use numpy to calculate
the column-wise mean, but the axis argument is quite confusing for me, so I
devised my own function to calculate the column-wise mean.
def getmean(z):
    temp=[]
    for j in range(len(z[0])):
        sum=0
        for i in range(len(z)):
            sum+=z[i][j];
        sum/=len(z)
        temp.append(int(sum))
    return temp
That's it ? THAT'S ALL there is to K-Means Clustering.
So, the cluster centroids are the K centres for our K number of
clusters. And the C vector contains the indexes of all centroid to which our X
data sets are associated with.
Note that, Size of C == length of the data set, and not the length of
the features in the data set.
However, there arises a question, what should be the ideal number of K,
as we can see, K can take a value between 1 and m (length of our dataset). So,
what should be the ideal value of K.
To choose that, we need to first decide a cost function.
J(µ1, µ2, µ3…. µk, c1,
c2, c3…. cm) = ( ∑ || x(i) - µc(i) ||2 )/ m
what it means is that, we are trying
to find a particular pair of centroids and their associated clusters, such
that, the average of the sum of their squared distance is minimum.
So, now, if we choose a very low
value of K, let's say 1, then the Cost Function J would have a very high value.
Similarly, if we pick a very high
value of K, let's say m (size of the
data set), we get a very low value of J, which would in fact be zero. Moreover,
it would cancel out the objective of clustering.
So, what should be the ideal value of
K?
if we plot K à J, we get an arm shaped graph plot. And
what we do is, look for the elbow point in that graph shaped plot.

The corresponding value of K is considered to be the ideal no of clusters
to be taken.
Now, let's apply this algorithm, to compress an image. As, we know,
K-Means helps us in locating those particular set of points, which are the
centroids of clusters. How can it be applied for image compression? It's quite
simple! We'll treat the image as an array of [R,G,B] values, and we'll find a
particular set of values, around which, many other values are clustered around.
Then we'll replace all the values in the clusters, with their particular set of
centroids. and thus reduce the values of the number of colours used in the
image.
So let's device a function, which de-shapes the whole image in a set of
array of RGB values.
def deshape(img):
    arr=[]
    for i in img:
        for x in np.array(i,dtype="uint8").tolist():
            print(x)
            arr.append(x)
    return arr
Now, what we have done is covert a Height*Width*3 3D array into a [Height*Width]*3
2D array. So, we'll read an image using openCV, and then pass it to our deshape
function to obtain an array of values, arr.
Now, we'll decide the number of K, as well as the iterations. Using our
value of K, we'll initialize our random Cluster
Centroids and then pass it to our clustering function along with arr and no of
iterations.
img=(cv2.imread("112.jpeg"))
arr=deshape(img)
K=100
iterations=5
Clusteroids=ClusterInit(arr, K)
print(arr[0])
print(Clusteroids)
data=Clusetering(arr, Clusteroids, iterations)
Now, our Clustering Function, will perform the Kmeans algorithm for the number
of iterations and meanwhile keep on updating our clusteroids and indexes, simultaneously.
When the number of iterations are over, we'll pass our arr, indexes and the
cluster centroids to our compress functions, which would effectively, replace the
respective points in our cluster with the value of the clusteroid.
def Clusetering(arr,Clusteroids,iterations):
    for i in range(iterations):
        a=str(i)+"th Iteration\n"
        print(a)

        indexes=Closest(arr,Clusteroids)

        print("Computing means of clusteroids")
        a,Clusteroid=ComputeMeans(arr, indexes, Clusteroids)
        if(a=="end K means"):
            i=iterations
        Clusteroids=Clusteroid
    print("======================================================")
    compressed_data=Compress(arr,Clusteroids,indexes)
    return compressed_data
def Compress(arr,Clusteroids,indexes):
    a=[]
    for i in indexes:
        a.append(Clusteroids[i])
    return a
Hence, the value returned by the Clustering function is a 2D array of
compressed data. Which we'll now reshape back to a 3D array using the reshape
function, and then display the image.
def reshape(arr,r,c):
    img1=[]
    for i in range(len(arr)):
        if i==0:
            temp=[]
        elif (i%c)==0:
            img1.append(temp)
            temp=[]
        temp.append(arr[i])
    return img1
img2=reshape(data,img.shape[0], img.shape[1])
cv2.imshow("Original",cv2.resize(img,(500,500)))
cv2.imshow("Compressed",cv2.resize(np.array(img2,dtype="uint8"),(500,500)))
cv2.waitKey(0)
Result
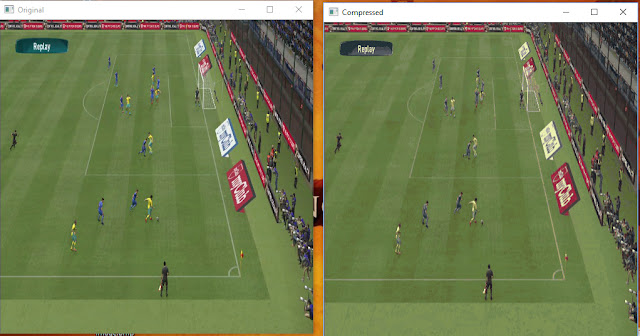
As, you can see, we have reduced the amount of colours used to just 100,
and yet, we have maintained more than 95% visibility of our image. Below,
attached is the code for this particular program. You can try it on your set of
images and tweak the value of K and iterations to your convenience.
P.S. the tqdm is a nice little tool you can use to view the iteration
progress, which is quite useful since this program may take time for higher
number of K.
That's it from this blog, if there are any suggestions, or corrections,
feel free to mention in the comment section. Also if you have any doubts, feel
free to ask.
References:-
- Machine Learning by Andrew Ng, Coursera.org (among the best MOOCs).
Comments
Post a Comment